Addressing the IMP’s five dimensions of impact using Amp Impact

Impact Management Project (IMP)

Share This Post

Background

Vera Solutions has designed and built Amp Impact based on 8+ years and 50+ implementations of portfolio-level impact management systems (not to mention 150+ related implementations tracking individual program- or enterprise-level impact). As a Certified B Corp, Vera is committed to amplifying the impact of organizations of all sectors, geographies, and sizes.

Vera endorses the Impact Management Project’s (IMP) definition of impact as the “positive and negative changes in outcomes for people and the planet” resulting from enterprises’ activities. Vera believes that this definition transcends sectors – that it applies equally for nonprofits and traditional grant-makers, for governments and government-funded initiatives, for social enterprises and impact investors, and for profit-driven enterprises and investors.

Through a consensus-building approach with over 2,000 organizations across a three-year period, the IMP has deconstructed impact into five dimensions, which enterprises and investors can use to fully understand their impact performance. The IMP defines them as follows:

IMPact Management Project collaboration. Impact Management Project success story. Vera Solutions Client. Vera Solutions Success. Vera Solutions data management. Example of data management. Example of Impact Analysis. Example of Performance Management. Monitoring and Evaluation Examples. Vera Solutions Client Success. Vera Solutions Collaboration. Vera Solutions Impact Management Client.
The five dimensions specify the categories of data that enterprises and investors should collect to assess their impact, but they do not prescribe the indicators that should be used or how impact management should be operationalized. Translating the dimensions into an investor’s portfolio management system depends on how the investor wishes to assess performance across each category.

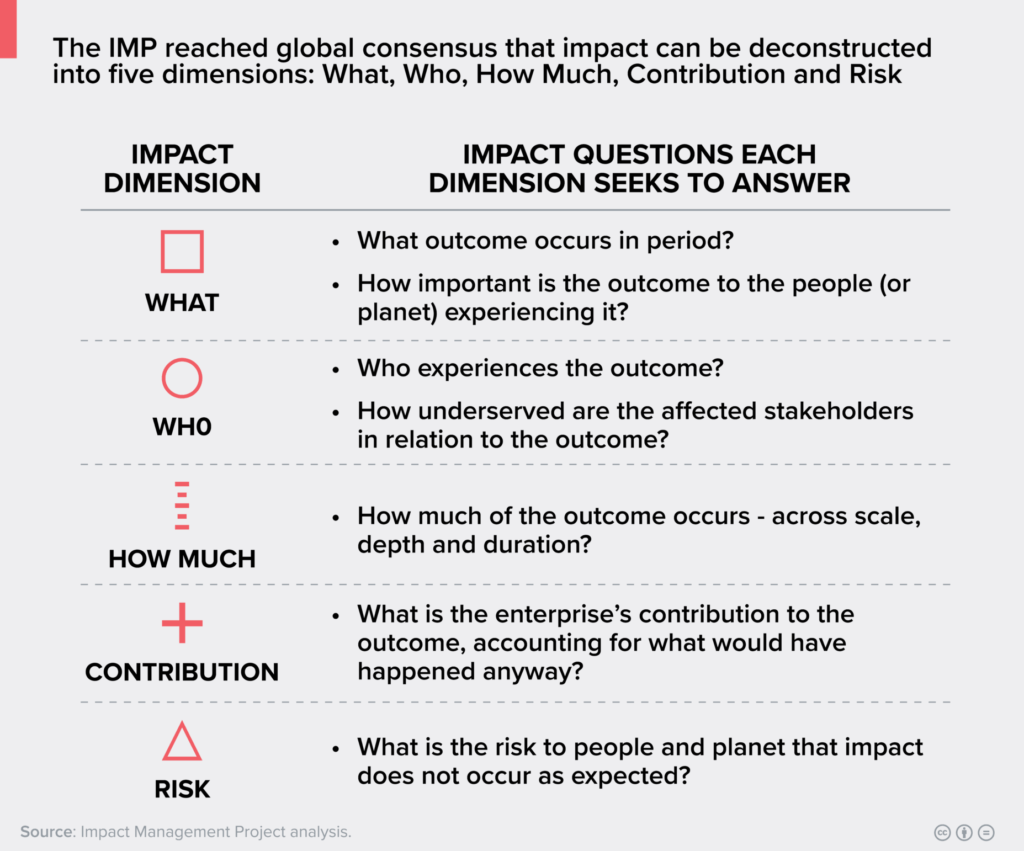
Built on Salesforce – the world’s most customizable platform – Amp Impact has been designed to be flexible and accommodate the different ways in which investors manage impact. Amp Impact’s core data model and features are aligned with the five dimensions: the relational structure between Objectives, Indicators, Results, Geographic Areas, and other data objects creates a powerful and common-sense way of assessing three of the impact dimensions: ‘What’, ‘Who’, and ‘How Much’ while Amp’s narrative Submission features allow for assessment of ‘Contribution’ and ‘Risk’ (as well as qualitative assessment of the other dimensions).

In this document, we highlight how each dimension can be addressed using out-of-the-box (OOB) Amp Impact features or simple Salesforce configuration.

How Amp Impact addresses each IMP impact dimension

Impact Dimension
OOB Amp Impact Functionality
Additional Configuration
Screen-Shot-2019-07-02-at-7.14.52-PM
Typically, the ‘What’ dimension is addressed using Amp Impact’s Objectives functionality, often managed on the LogFrame page. The page can be used in a ‘flat’ way to capture the intended and unintended Outcomes of an Investment or can be used in a hierarchical way to construct a LogFrame for the Investment (Impacts > Outcomes > Outputs > Activities > Inputs).
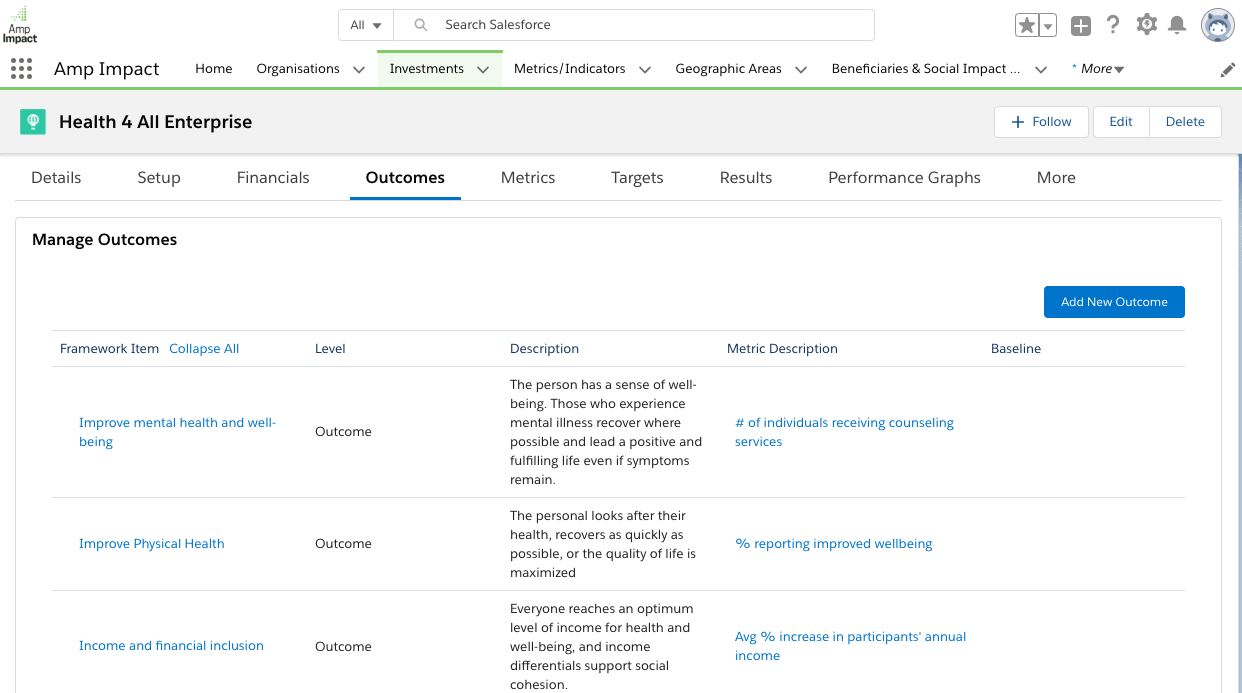
  • Indicators can be connected to one or more Outcomes / Objectives.
  • Thematic Areas can also be used to tag Investments with high-level outcomes and the SDG Plug-in can be used to connect an Investment to its related SDGs.
  • Outcome thresholds can be set either using Targets and optionally using Amp’s Indicator Stoplight Thresholds.
Fields can be added on the Objective and/or Project Objective objects to capture additional aspects of Outcomes, such as:
  • Intended vs unintended
  • Positive vs negative
  • Importance or weight
Screen-Shot-2019-07-02-at-7.14.57-PM
The ‘Who’ dimension is addressed with numerous OOB functionalities:
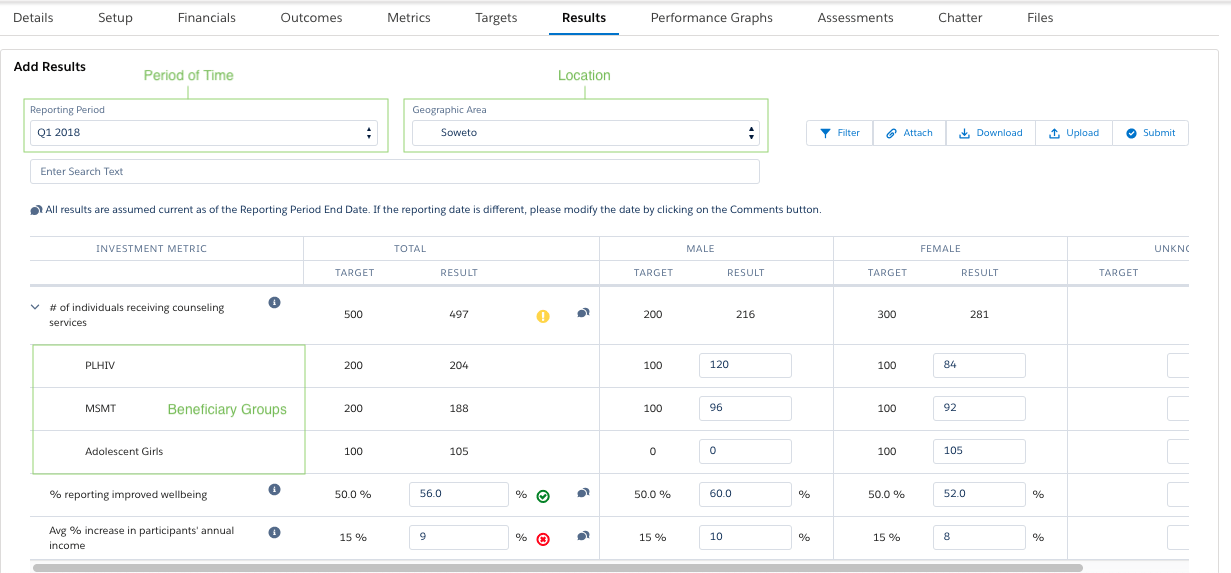
  • Geographic Areas allow for geographic disaggregation and analysis of Results at any level (facility, community, neighborhood, city, district, province, country)
  • Thematic Areas can be used to tag an Investment with different types of Beneficiary Groups.
  • Disaggregation Values can separate Results across types of Beneficiaries (e.g. income level, age group, rural/urban, etc)
  • Cross-disaggregation allows for Result data to additionally be broken down by sex or gender.
A Baseline reporting period can be used to capture Baseline values of Indicators for certain groups.
Narrative Submission Templates or additional fields could be configured on the Investment object to capture additional narrative data about ‘Who’ benefits from an Investment.
Screen-Shot-2019-07-02-at-7.15.04-PM

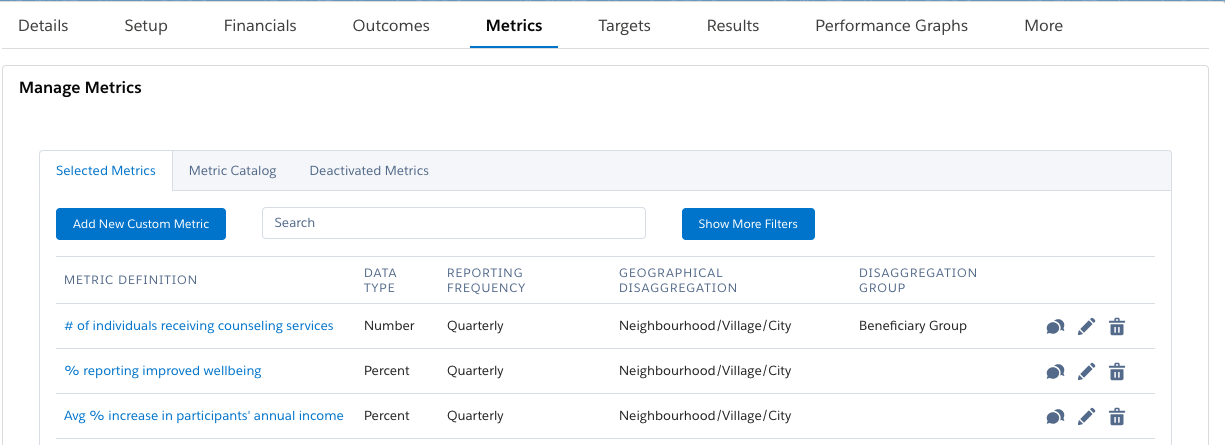
Amp Impact has robust, flexible indicator management functionality that enables users to define metrics used to measure ‘How Much’ impact an investment generates.

  • Available Data Types: numbers, percentages, currencies, milestones, or qualitative.
  • Indicators can be classified by Level (impact, outcome, output) and by Type (e.g. scale vs depth).
  • Results can be input, calculated from other indicators, or aggregated from other data in Salesforce.
  • Duration of an outcome is measured by tracking an Indicator’s Results over time, across Reporting Periods.

Often, achievement of Scale for an outcome will be captured with different indicators than achievement of Depth.

Fields can be added to the Indicator or Investment Indicator objects to capture additional information needed for understanding the ‘How Much’ dimension.

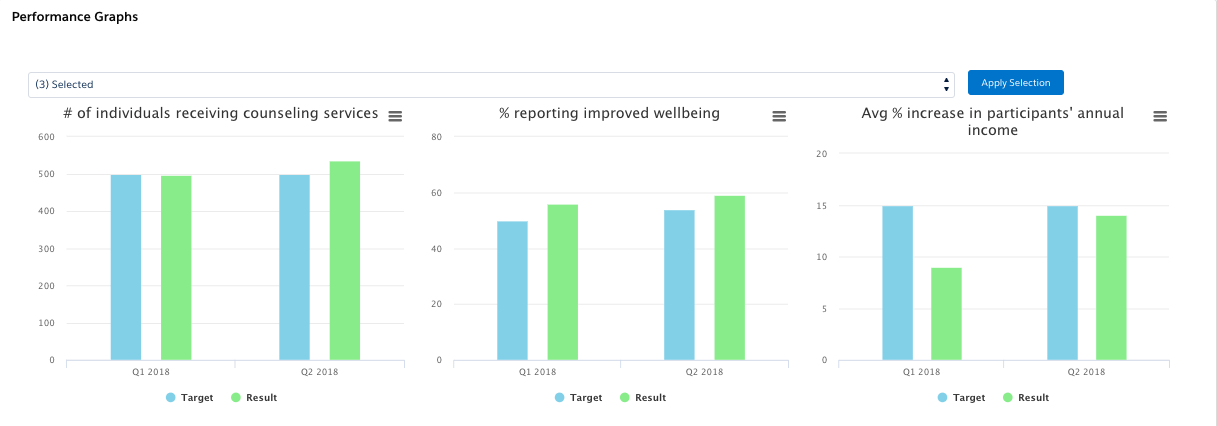
Salesforce Reports and Dashboards can be configured to slice and dice Result data, show scale and depth of impact over time, broken down by outcome, by thematic area, by beneficiary group, etc.
Screen-Shot-2019-07-02-at-7.15.09-PM
‘Contribution’ needs to be evaluated by comparing the impact observed against what would have happened otherwise. This should be done through research, evaluation, or benchmarking.
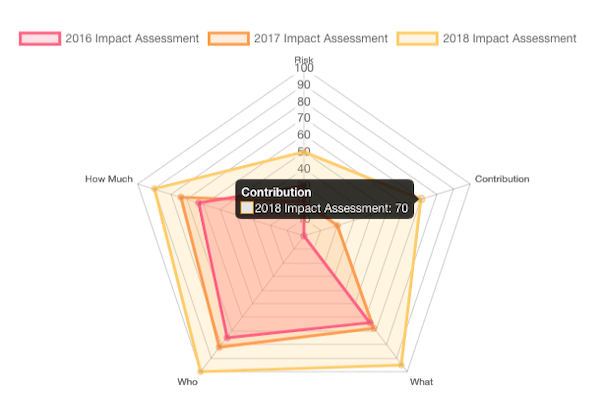
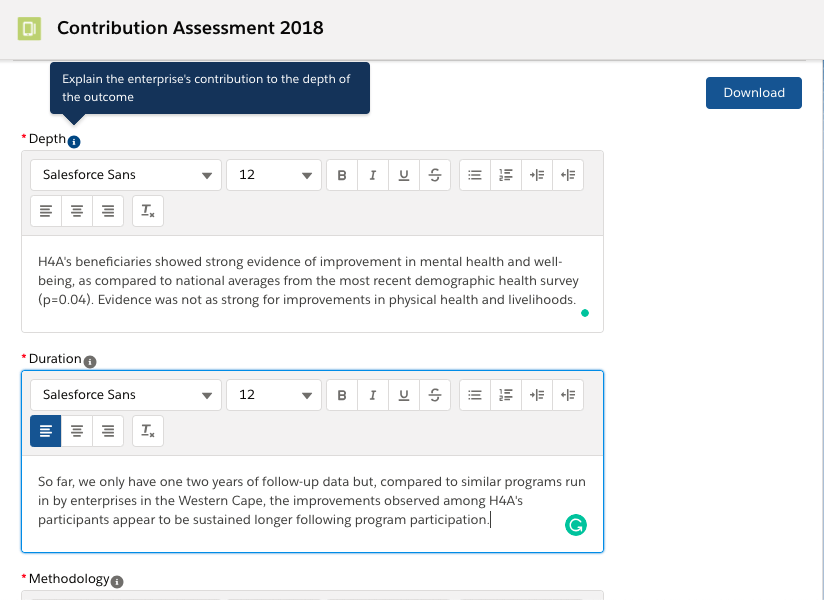
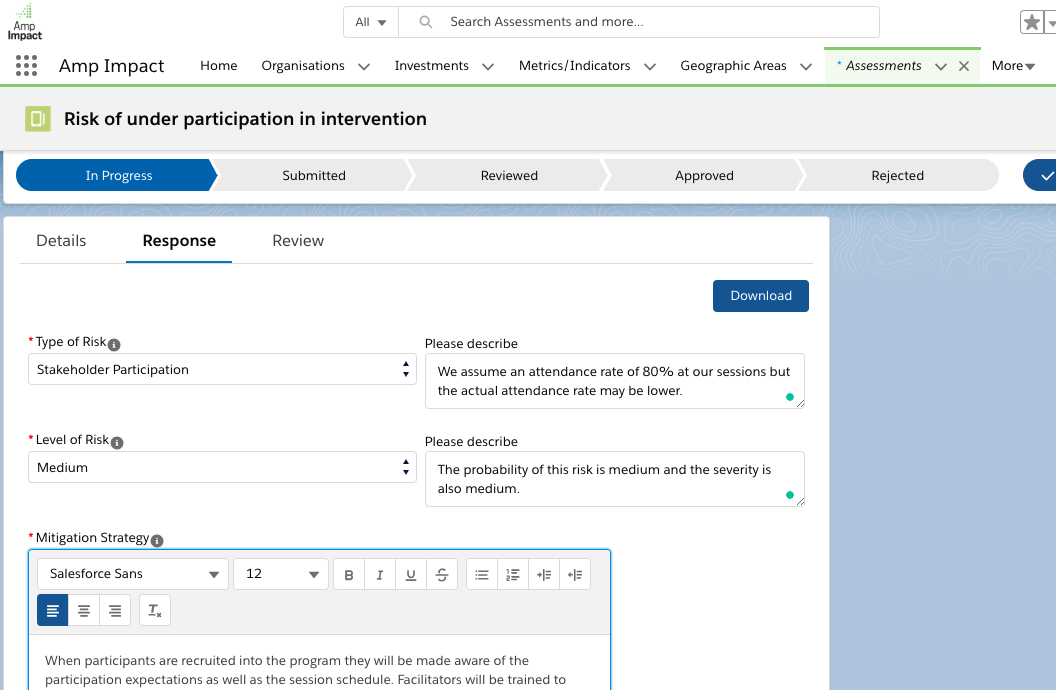
  • Narrative Submissions can be used to capture findings from evaluations and research, or explanations of the expected counterfactual depth and duration of impact.
Benchmark data can be uploaded or input into Amp on Results, with connections to Indicators, Geographic Areas, and Reporting Periods. This allows for comparison between an Investment’s Impact and the counterfactual, using Salesforce Reports and Dashboards.
Screen-Shot-2019-07-02-at-7.15.14-PM
Impact ‘Risk’ can be assessed in Amp using Submissions functionality, by creating an Impact Risk Assessment template or as a section in an overall Impact Assessment template (see screenshot 6). Vera is working with the Open Road Alliance and a mix of funder stakeholders to design a Risk Management module into Amp Impact that we plan to launch in 2019.
If an organization wants a dedicated data structure for Risk Management, a Risk object can be configured into Amp, related to Investment. Fields can be configured to align the structure to the one laid out by the IMP (risk type, risk level, mitigation strategy).

Capturing impact dimensions in Amp Impact

Overall Impact Assessment across the five dimensions of impact, using Amp Submissions. A radar chart like the one below can be used to see changes in scores over time across the dimensions (for instance, this investment is improving over time on all dimensions and is performing better on ‘Who’, ‘What’, and ‘How Much’ than on ‘Contribution’ or ‘Risk’):
image5-1
Capturing the ‘What’ impact dimension of impact using Outcomes on the LogFrame page:
Capturing the ‘Who’ impact dimension using Results (Reporting Periods, Geographic Areas, Disaggregation):
Capturing the ‘How Much’ impact dimension using Indicators/Metrics, Results, Performance Graphs:
Capturing the ‘Contribution’ impact dimension using Amp Submissions functionality:
Capturing the ‘Risk’ impact dimension using Amp Submissions functionality:
By the way, investees and investors can also use Amp Impact to manage portfolio financials—tracking budget, expenditure, and revenue—and even Download/Upload Financial Reports using Excel.
Aquila_Upload-Budget
Ready to check out Amp Impact for yourself?

Related Blogs